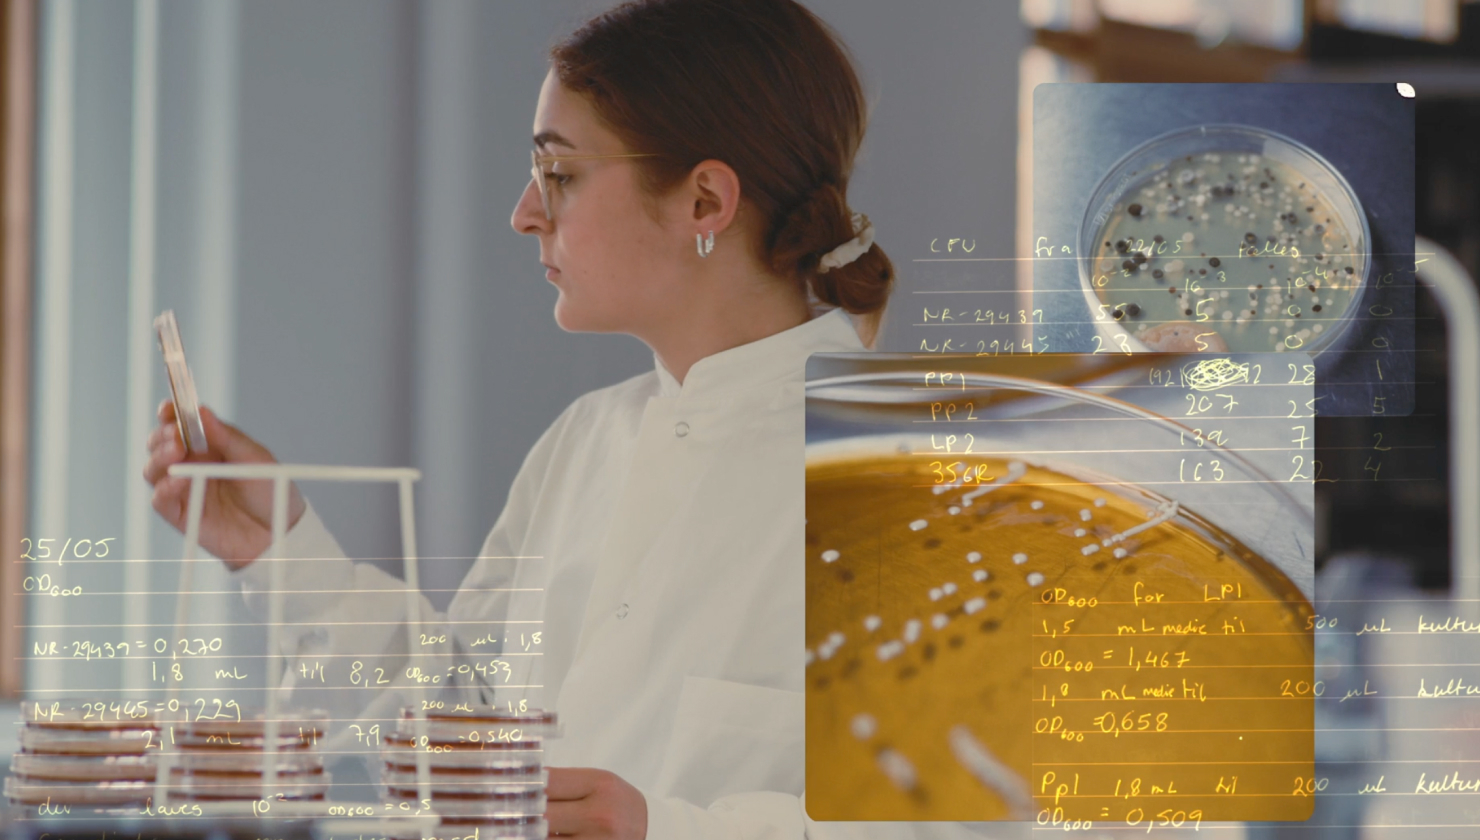

In biotech research, insights rarely come from a single plate.
They come from patterns across plates. Across jobs. Across days. Across organisms. And almost always, they come from context.
Reshape has already helped teams automate imaging and generate high-accuracy time-of-appearance data. The next step is making that data useful at scale, so scientists can zoom out, compare conditions, and turn dozens of runs into confident decisions.
That’s why we’re introducing our Organism Library: a new way to explore organism insights across multiple jobs and experimental conditions, right inside Reshape.
The problem: great data, hard to synthesize
If you’re designing or refining an assay, you’re asking questions like: When does this organism typically show up? How much is that affected by shifts in temperature or media? What’s “normal” across my previous runs?
Today, teams often answer these with a mix of exported spreadsheets, manual filtering, and memory. It works… until it doesn’t.
Once you’re running multiple assays per organism, comparing different media, and iterating timelines, the “quick spreadsheet check” turns into a fragile, exhausting exercise. And when the synthesis is hard, decisions slow down, meaning assay optimization takes longer, comparisons get inconsistent and learnings stay siloed in individual assays.
You end up with lots of data – but not enough knowledge.
Introducing Organism-level Aggregated Insights
In this first release of many in our organism library, we let users aggregate time-of-appearance across jobs and their properties, giving a clean, comparable view of how organism behavior changes in the real world.
Here’s what you can do:
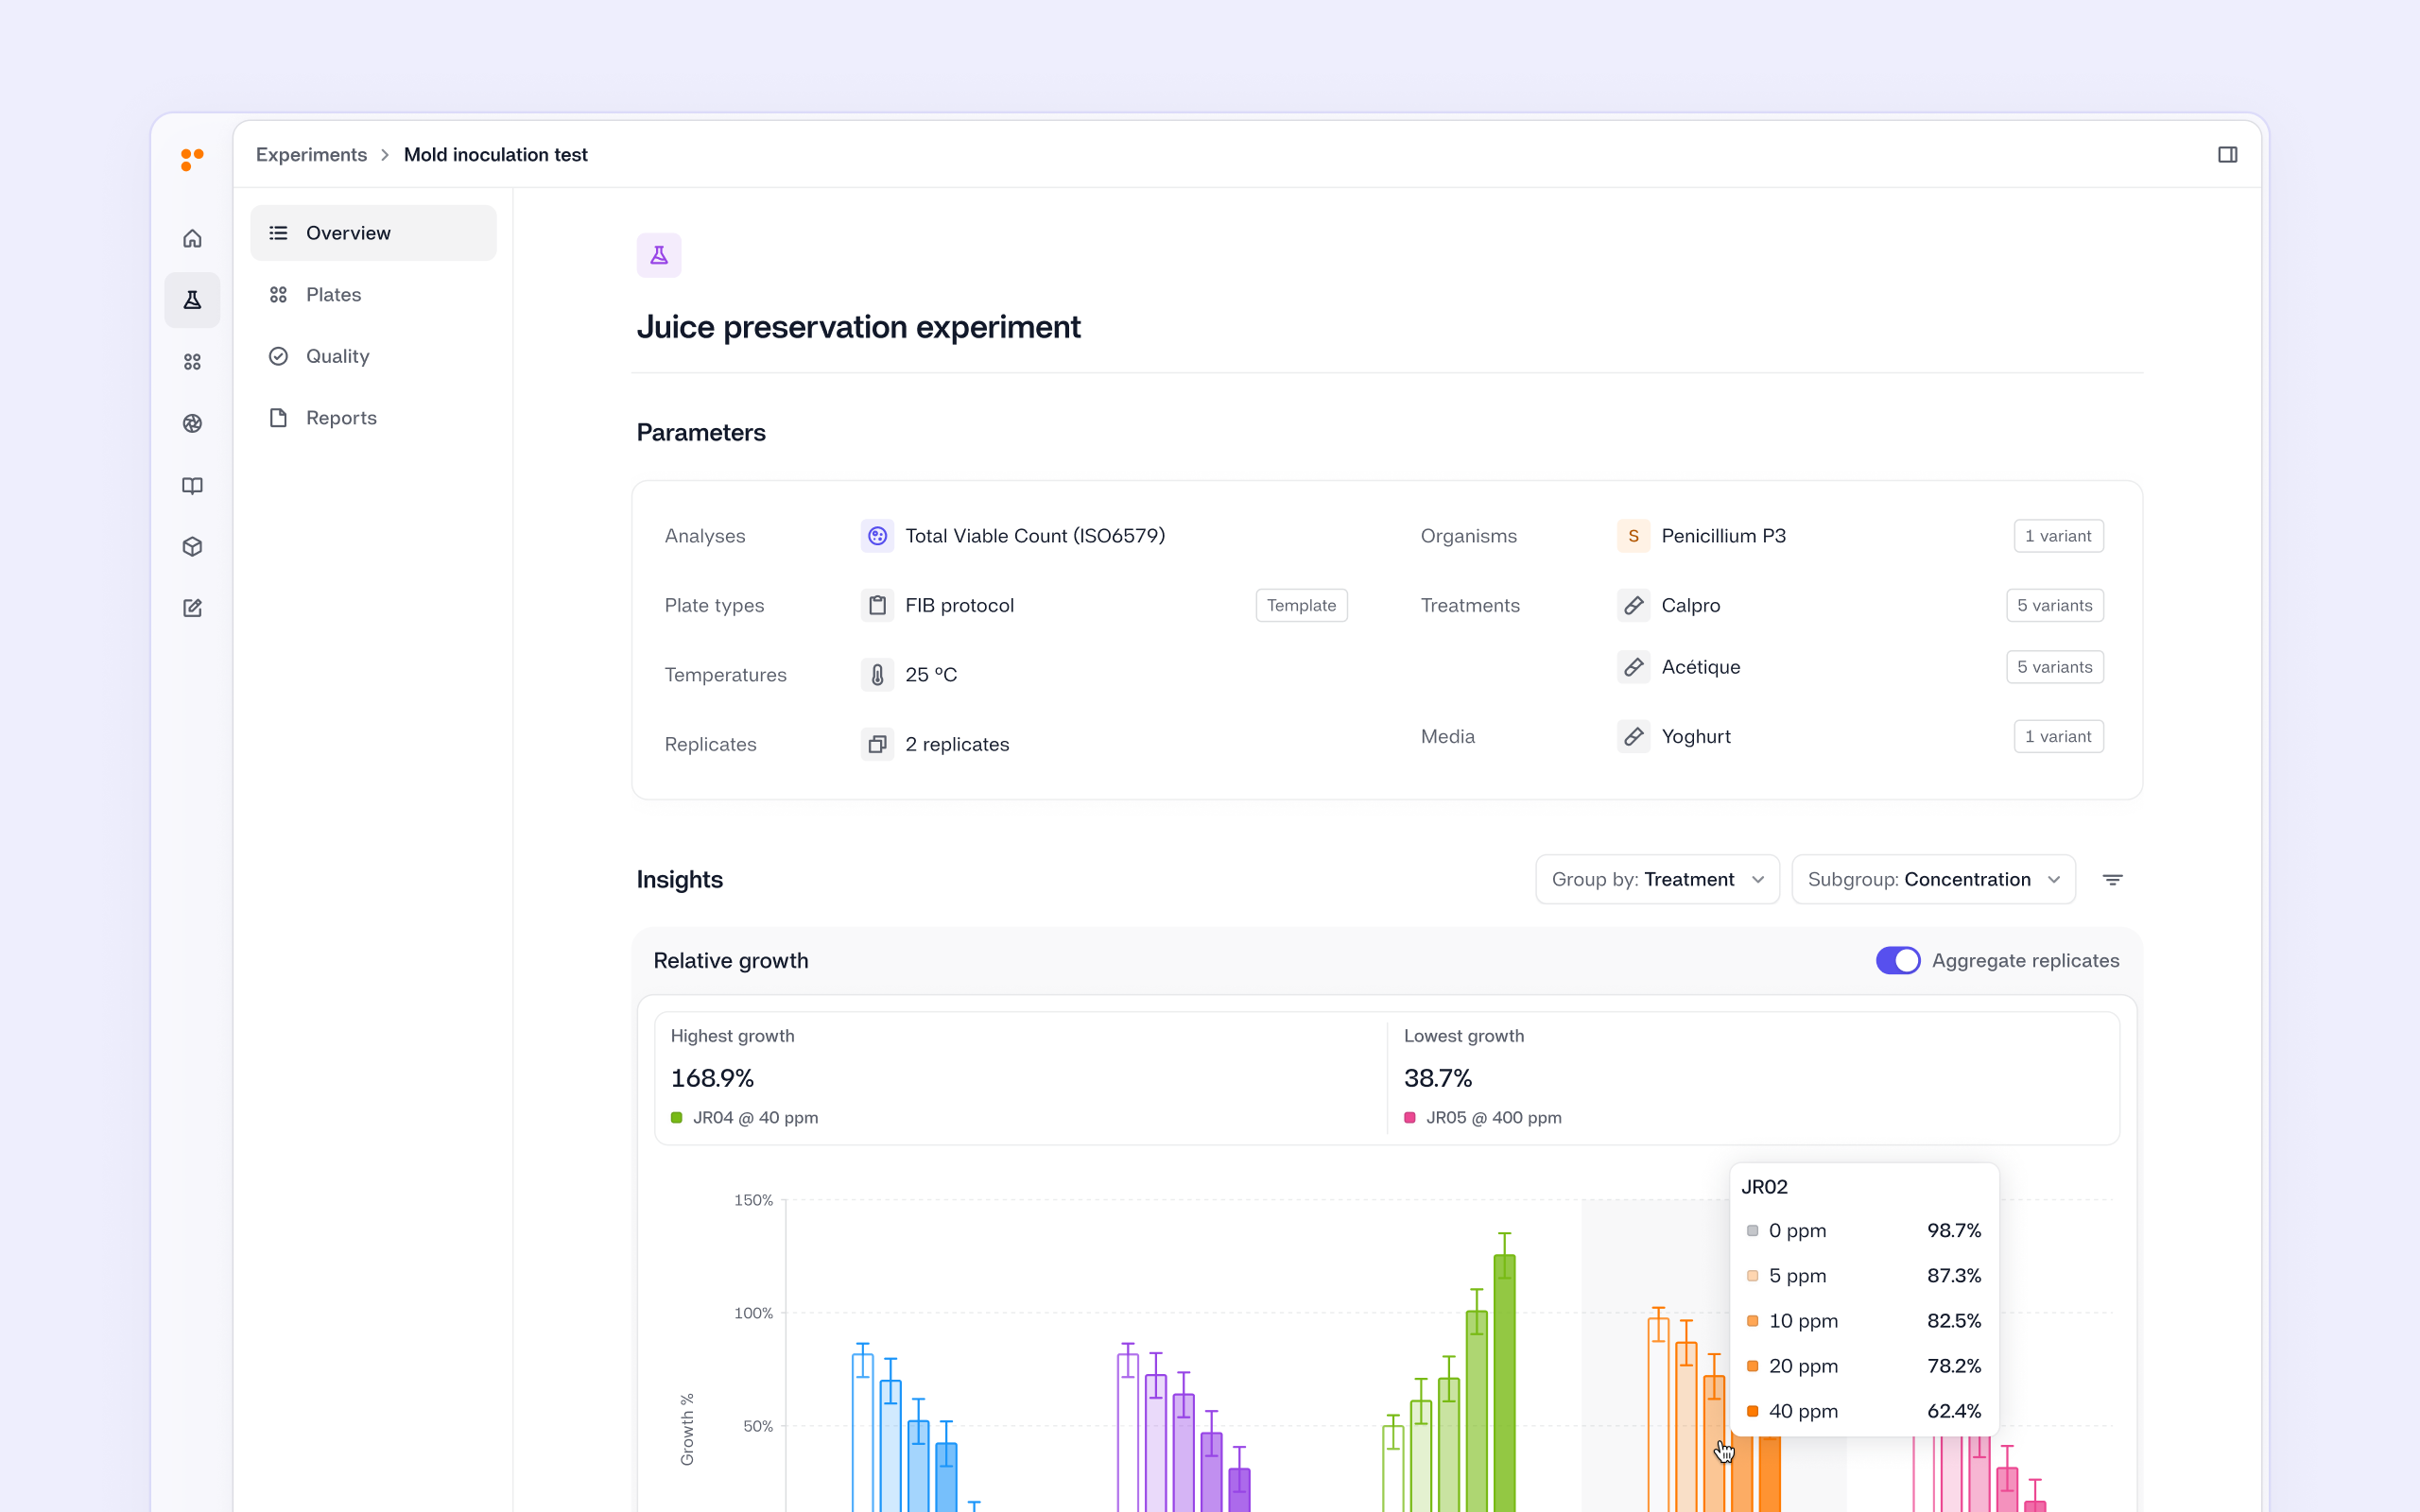
• View time of appearance across jobs
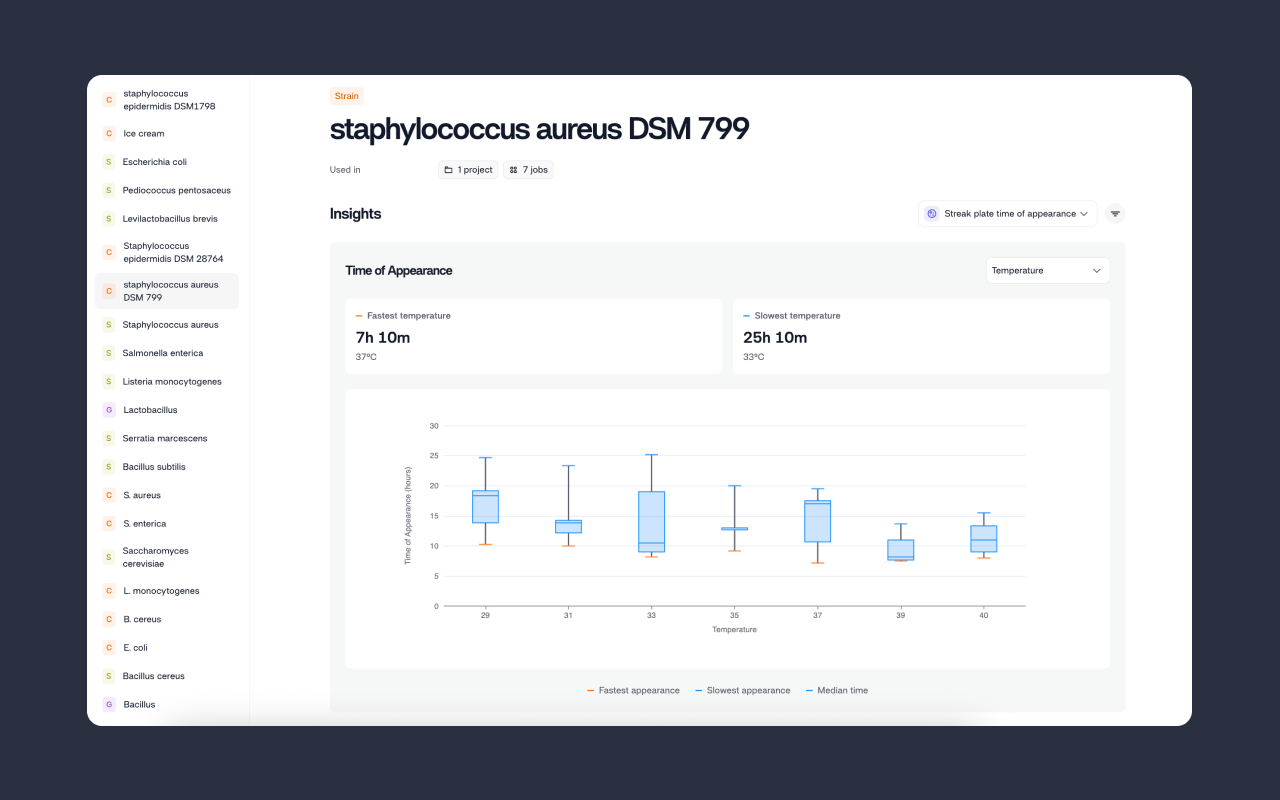
Pick an organism and instantly see its time-of-appearance distribution across past runs – not locked to a single job, but aggregated from many.
That means if you’ve run Staphylococcus aureus in three media types across two temperatures, you can compare all of it in one place.
• Visualize variation with clear distributions
Instead of scanning row-by-row values, you get a boxplot view showing fastest, slowest, and typical appearance times across conditions. This makes it easy to spot which conditions tighten variance, which shift appearance earlier/later, and where your assay timeline should realistically sit.
Watch our Product Lead, Aimée van de Schoor, explain the Organism Library in the video below.
Why this matters: faster, better assay design
Scientists don’t run assays for the joy of running assays. Well, sometimes that may just be the case, but usually, we run assays to learn something.
Aggregated insights help close the gap between data acquisition and future experimental decisions, whether that is choosing the best-performing media, setting the right read timelines, or understanding organism behavior across many assays
Essentially, this should make it easier and faster to make decisions about your assays.
A step toward Reshape as an insights platform
This is more than another visualization. It’s the first deliverable in a broader shift where Reshape will help you place strategic bets and not “just” help you acquire data.
Aggregated organism-level insights are a building block toward a future where Reshape both supports what happened in a specific assay, but also helps you make sense of your entire experimental history.
What’s next
This release is in beta and already demo-ready for existing users. We’re rolling it out incrementally, with early access available now.
Next up we’re looking to help our users aggregate more insights on a project or job level.
If you’re a Reshape user and want to try this, head over to the Library page and request early access. We’d love your feedback as we shape the next iterations.
This will not only make Reshape data easy to trust, but also easy to compare and benchmark against other jobs' data, and most importantly, act on.
Stay tuned.